Monthly Market Risk Update: April 2024 [SlideShare]
GSPL
1. 1QFY2011 Result Update | Oil & Gas
July 30, 2010
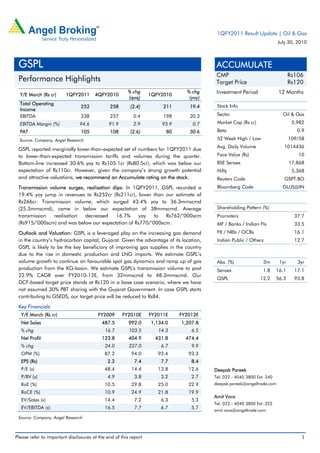
GSPL ACCUMULATE
CMP Rs106
Performance Highlights Target Price Rs120
Y/E March (Rs cr) 1QFY2011 4QFY2010
% chg
1QFY2010
% chg Investment Period 12 Months
(qoq) (yoy)
Total Operating Stock Info
252 258 (2.4) 211 19.4
Income
EBITDA 238 237 0.4 198 20.3 Sector Oil & Gas
EBITDA Margin (%) 94.6 91.9 2.9 93.9 0.7 Market Cap (Rs cr) 5,982
PAT 105 108 (2.6) 80 30.6 Beta 0.9
Source: Company, Angel Research 52 Week High / Low 109/58
Avg. Daily Volume 1014436
GSPL reported marginally lower-than-expected set of numbers for 1QFY2011 due
to lower-than-expected transmission tariffs and volumes during the quarter. Face Value (Rs) 10
Bottom-line increased 30.6% yoy to Rs105.1cr (Rs80.5cr), which was below our BSE Sensex 17,868
expectation of Rs110cr. However, given the company’s strong growth potential Nifty 5,368
and attractive valuations, we recommend an Accumulate rating on the stock. Reuters Code GSPT.BO
Transmission volume surges, realisation dips: In 1QFY2011, GSPL recorded a Bloomberg Code GUJS@IN
19.4% yoy jump in revenues to Rs252cr (Rs211cr), lower than our estimate of
Rs266cr. Transmission volume, which surged 43.4% yoy to 36.3mmscmd
(25.3mmscmd), came in below our expectation of 38mmscmd. Average Shareholding Pattern (%)
transmission realisation decreased 16.7% yoy to Rs762/’000scm Promoters 37.7
(Rs915/’000scm) and was below our expectation of Rs770/’000scm. MF / Banks / Indian Fls 33.5
Outlook and Valuation: GSPL is a leveraged play on the increasing gas demand FII / NRIs / OCBs 16.1
in the country’s hydrocarbon capital, Gujarat. Given the advantage of its location, Indian Public / Others 12.7
GSPL is likely to be the key beneficiary of improving gas supplies in the country
due to the rise in domestic production and LNG imports. We estimate GSPL’s
volume growth to continue on favourable spot gas dynamics and ramp up of gas Abs. (%) 3m 1yr 3yr
production from the KG-basin. We estimate GSPL's transmission volume to post Sensex 1.8 16.1 17.1
22.9% CAGR over FY2010-12E, from 32mmscmd to 48.3mmscmd. Our
GSPL 12.2 56.3 93.8
DCF-based target price stands at Rs120 in a base case scenario, where we have
not assumed 30% PBT sharing with the Gujarat Government. In case GSPL starts
contributing to GSEDS, our target price will be reduced to Rs84.
Key Financials
Y/E March (Rs cr) FY2009 FY2010E FY2011E FY2012E
Net Sales 487.5 992.0 1,134.0 1,207.8
% chg 16.7 103.5 14.3 6.5
Net Profit 123.8 404.9 431.8 474.4
% chg 24.0 227.0 6.7 9.9
OPM (%) 87.2 94.0 93.4 93.3
EPS (Rs) 2.2 7.4 7.7 8.4
P/E (x) 48.4 14.4 13.8 12.6 Deepak Pareek
P/BV (x) 4.9 3.8 3.2 2.7 Tel: 022 - 4040 3800 Ext: 340
RoE (%) 10.5 29.8 25.0 22.9 deepak.pareek@angeltrade.com
RoCE (%) 10.9 24.9 21.8 19.9
Amit Vora
EV/Sales (x) 14.4 7.2 6.3 5.3
Tel: 022 - 4040 3800 Ext: 322
EV/EBITDA (x) 16.5 7.7 6.7 5.7
amit.vora@angeltrade.com
Source: Company, Angel Research
Please refer to important disclosures at the end of this report 1
2. GSPL | 1QFY2011 Result Update
Exhibit 1: 1QFY2011 Performance
Y/E March (Rs cr) 1QFY2011 4QFY2010 % chg (qoq) 1QFY2010 % chg (yoy) FY2010 FY2009 % chg (yoy)
Total Operating Income 252 258 (2.4) 211 19.4 992 487 103.5
Total operating expenditure 14 21 (34.4) 13 6.7 60 63 (5.5)
EBITDA 238 237 0.4 198 20.3 932 425 119.7
EBITDA Margin (%) 94.6 91.9 93.9 94.0 87.1
Other Income 6 12 (52.8) 4 62.7 25 24 1.8
Depreciation 69 63 8.7 55 24.9 236 170 38.7
Interest 22 22 (0.3) 25 (8.5) 94 87 7.9
PBT before GSEDS 153 163 (6.6) 122 25.1 627 191 227.6
GSEDS contribution (30% of PBT) - - - - -
PBT post GSEDS 153 163 (6.6) 122 25.1 627 191 227.6
PBT Margin (%) 60.6 63.4 57.9 63.2 39.3
Total Tax 48 56 (14.3) 42 14.6 213 68 213.7
% of PBT 31.2 34.0 34.0 34.0 35.5
PAT 105 108 (2.6) 80 30.6 414 123 235.3
PAT Margin (%) 41.7 41.8 38.2 41.7 25.3
Gas volume transported (mmscmd) 36.3 36.4 (0.3) 25.3 43.4 32.0 14.9 115.0
Average Realisation/ '000scm 762 787 (3.1) 915 (16.7) 850 898 (5.4)
Source: Company, Angel Research
Exhibit 2: 1QFY2011 Actual v/s Estimates
(Rs cr) Estimates Actual Variation (%)
Total Operating Income 266 252 (5.4)
EBITDA 249 238 (4.3)
EBITDA Margin (%) 93.4 94.6 1.1
PBT 166 153 (8.2)
PAT 110 105 (4.3)
Source: Company, Angel Research
Revenue up by 19.4%, marginally below expectation: In 1QFY2011, GSPL
recorded a 19.4% yoy jump in revenue to Rs252cr (Rs211cr), which was lower
than our expectation of Rs266cr. Transmission volume surged by a 43.4% yoy,
whereas average realisations decreased 16.7% yoy. Transmission volume during
the quarter increased yoy to 36.3mmscmd (25.3mmscmd), which was lower than
our expectation of 38mmscmd. Realisations stood lower yoy at Rs762/’000scm
(Rs915/’000scm), below our expectation of Rs770/’000scm. Transmission volume
during the quarter was boosted by gas from the KG basin and higher LNG
volumes.
July 30, 2010 2
3. GSPL | 1QFY2011 Result Update
Exhibit 3: Operating revenue trend
300 70.0
59.7 60.0
250
50.0
200
40.0
(Rs cr)
150 30.0
(%)
20.8 20.0
100
5.4 10.0
50 (3.9) (2.4)
-
- (10.0)
1QFY10 2QFY10 3QFY10 4QFY10 1QFY11
Total operating revenues Total operating revenues growth (RHS)
Source: Company, Angel Research
OPM above expectation on lower opex; expands by 65bp yoy and 265bp qoq to
94.6%: Staff cost during the quarter decreased by 7.1% yoy to Rs2.6cr, whereas
gas transportation charges (which was Rs0.4cr in 1QFY2010) were reported to be
nil during 1QFY2011, in line with management’s guidance. O&M expenses
increased (due to higher compression cost) by 35.5% yoy to Rs8.2cr (Rs6.0cr).
Lower-than-expected opex came on account of 19.7% yoy fall in administrative
expenses to Rs2.9cr (Rs3.6cr). Thus, absence of gas transportation charges, lower
administration cost and operating leverage benefits resulted in OPM expanding by
65bp yoy to 94.6% (93.9%), which was above our expectation of 93.4%. As a
result, EBITDA registered 20.3% yoy growth to Rs238cr (Rs198cr) during
1QFY2011. Sequentially too, OPMs expanded by 265bp to 94.6% (91.9%).
Exhibit 4: Operating proft trend
300 97.0
95.9 96.0
250
94.6 95.0
200 93.9 94.3 94.0
(Rs cr)
(%)
150 93.0
91.9 92.0
100
91.0
50
90.0
- 89.0
1QFY10 2QFY10 3QFY10 4QFY10 1QFY11
Operating Profit Operating Margins (RHS)
Source: Company, Angel Research
July 30, 2010 3
4. GSPL | 1QFY2011 Result Update
Depreciation increases because of capitalisation; interest falls: Depreciation grew
by 24.9% yoy to Rs68.7cr (Rs55cr) owing to capitalisation of new pipelines.
However, interest expenses fell 8.5% yoy to Rs22.4cr (Rs24.5cr), but flat qoq.
PAT marginally below expectation, up 30.6%: Other income rose 62.7% yoy to
Rs5.7cr (Rs3.5cr). However, on a sequential basis, other income fell by 52.8% to
Rs5.7cr (Rs12.1cr). Effective tax rate during the quarter fell to 31.2% (34%). Also,
there was no contribution made to GSEDS during the quarter. Higher volume,
OPM expansion and lower effective tax rate led to PAT increasing by 30.6% yoy to
Rs105.1cr (Rs80.5cr), which was marginally below our expectation of Rs110cr.
Exhibit 5: PAT growth trend
140 131.6 140.0
120 120.0
100 100.0
80.0
80
(Rs cr)
(%)
60.0
60
36.7 40.0
40 20.0
(2.6)
20 4.8 -
(6.5)
- (20.0)
1QFY10 2QFY10 3QFY10 4QFY10 1QFY11
PAT PAT growth (RHS)
Source: Company, Angel Research
Investment Arguments
Tariff decline risk captured in valuation: Transmission tariff is one of the biggest
variables impacting GSPL's valuations, and we believe that the tariffs are unlikely to
fall below Rs0.68/scm levels in FY2012E and beyond. Competitive tariffs coupled
with low volume flows had resulted in low RoCE of 7-10% during FY2003-09,
which was lower than the mandated PNGRB's regulated IRR of 12% on pipeline
projects. Thus, on account of the same, GSPL's network was not able to gets its
mandated returns.
New pipelines could open up growth vistas: GSPL now seeks to expand its
operations beyond the state. In wake of the same, GSPL has submitted Expression
of Interest (EoIs) for four inter-state pipelines. These pipelines will have a combined
length of 5,675km. If GSPL is able to bag any of these pipelines, concerns of
scalability of operations beyond Gujarat will cease to a large extent. We are
currently not ascribing any value to these pipelines in our target price. However, if
the company bags the Mehsana-Bhatinda pipeline, it could add around Rs25-30
to our target price.
July 30, 2010 4
5. GSPL | 1QFY2011 Result Update
Outlook and Valuation
GSPL is a leveraged play on the increasing gas demand in Gujarat, the
hydrocarbon capital of the country. Benefiting from its location, GSPL is likely to be
the key beneficiary of the country’s improving gas supplies on account of rising
domestic production and LNG imports. We estimate the company's volume growth
to continue because of favourable spot gas dynamics and ramp up of gas
production from the KG-basin. We estimate GSPL's transmission volume to
increase by 22.9% CAGR over FY2010-12E, from 32mmscmd to 48.3mmscmd.
Given the company's intent to expand beyond Gujarat, we believe that it is
emerging as an attractive play on the domestic natural gas theme. If GSPL is able
to win any of the EoIs submitted to PNGRB, scalability issues will get addressed to a
large extent.
GSPL follows an aggressive depreciation policy, wherein it depreciates its assets at
a rate of 8.30% vis-à-vis the depreciation rate of 3.17% employed by peer GAIL.
Thus, on account of the same, GSPL's book value stands understated. However, if
we were to apply the depreciation rate of GAIL for GSPL (with retrospective effect),
GSPL's FY2011E and FY2012E adjusted book value (ABV) will increase to
Rs43.1/share and Rs52.6/share, respectively. Thus, at the current price of
Rs106/share, the stock is trading at FY2012E P/ABV of 2.0x compared to an
implied P/ABV of 2.3x (at our DCF-based target price of Rs120), which provides an
attractive entry point for investors.
Our DCF-based 12-month target price for GSPL stands at Rs120 in the base case
scenario, where we have not assumed 30% PBT sharing with the Government of
Gujarat. In case GSPL starts contributing to GSEDS, our target price will reduce to
Rs84. At current levels, we recommend an Accumulate rating on the stock, with a
Target Price of Rs120, translating into an upside of 12.8%.
Exhibit 6: Key Assumptions
Particulars FY2011E FY2012E
Gas volume transported (mmscmd) 42.41 48.33
Avg Realisations/'000scm 0.73 0.68
Source: Company, Angel Research
Exhibit 7: Angel EPS forecast v/s consensus (Rs)
Angel Forecast Bloomberg Consensus Variation (%)
FY2011E 7.7 7.6 1.2
FY2012E 8.4 8.9 (5.0)
Source: Company, Angel Research
July 30, 2010 5
11. GSPL | 1QFY2011 Result Update
Research Team Tel: 022 - 4040 3800 E-mail: research@angeltrade.com Website: www.angeltrade.com
DISCLAIMER
This document is solely for the personal information of the recipient, and must not be singularly used as the basis of any investment
decision. Nothing in this document should be construed as investment or financial advice. Each recipient of this document should make
such investigations as they deem necessary to arrive at an independent evaluation of an investment in the securities of the companies
referred to in this document (including the merits and risks involved), and should consult their own advisors to determine the merits and
risks of such an investment.
Angel Broking Limited, its affiliates, directors, its proprietary trading and investment businesses may, from time to time, make
investment decisions that are inconsistent with or contradictory to the recommendations expressed herein. The views contained in this
document are those of the analyst, and the company may or may not subscribe to all the views expressed within.
Reports based on technical and derivative analysis center on studying charts of a stock's price movement, outstanding positions and
trading volume, as opposed to focusing on a company's fundamentals and, as such, may not match with a report on a company's
fundamentals.
The information in this document has been printed on the basis of publicly available information, internal data and other reliable
sources believed to be true, but we do not represent that it is accurate or complete and it should not be relied on as such, as this
document is for general guidance only. Angel Broking Limited or any of its affiliates/ group companies shall not be in any way
responsible for any loss or damage that may arise to any person from any inadvertent error in the information contained in this report.
Angel Broking Limited has not independently verified all the information contained within this document. Accordingly, we cannot testify,
nor make any representation or warranty, express or implied, to the accuracy, contents or data contained within this document. While
Angel Broking Limited endeavours to update on a reasonable basis the information discussed in this material, there may be regulatory,
compliance, or other reasons that prevent us from doing so.
This document is being supplied to you solely for your information, and its contents, information or data may not be reproduced,
redistributed or passed on, directly or indirectly.
Angel Broking Limited and its affiliates may seek to provide or have engaged in providing corporate finance, investment banking or
other advisory services in a merger or specific transaction to the companies referred to in this report, as on the date of this report or in
the past.
Neither Angel Broking Limited, nor its directors, employees or affiliates shall be liable for any loss or damage that may arise from or in
connection with the use of this information.
Note: Please refer to the important `Stock Holding Disclosure' report on the Angel website (Research Section). Also, please
refer to the latest update on respective stocks for the disclosure status in respect of those stocks. Angel Broking Limited and
its affiliates may have investment positions in the stocks recommended in this report.
Disclosure of Interest Statement GSPL
1. Analyst ownership of the stock No
2. Angel and its Group companies ownership of the stock Yes
3. Angel and its Group companies' Directors ownership of the stock No
4. Broking relationship with company covered No
Note: We have not considered any Exposure below Rs 1 lakh for Angel, its Group companies and Directors.
Ratings (Returns) : Buy (> 15%) Accumulate (5% to 15%) Neutral (-5 to 5%)
Reduce (-5% to 15%) Sell (< -15%)
July 30, 2010 11